Understanding how Microscope.ai scores your AI presence is essential for interpreting results and tracking progress. This guide explains the basic scoring system and what it means for your AI visibility.
Basic Scoring System
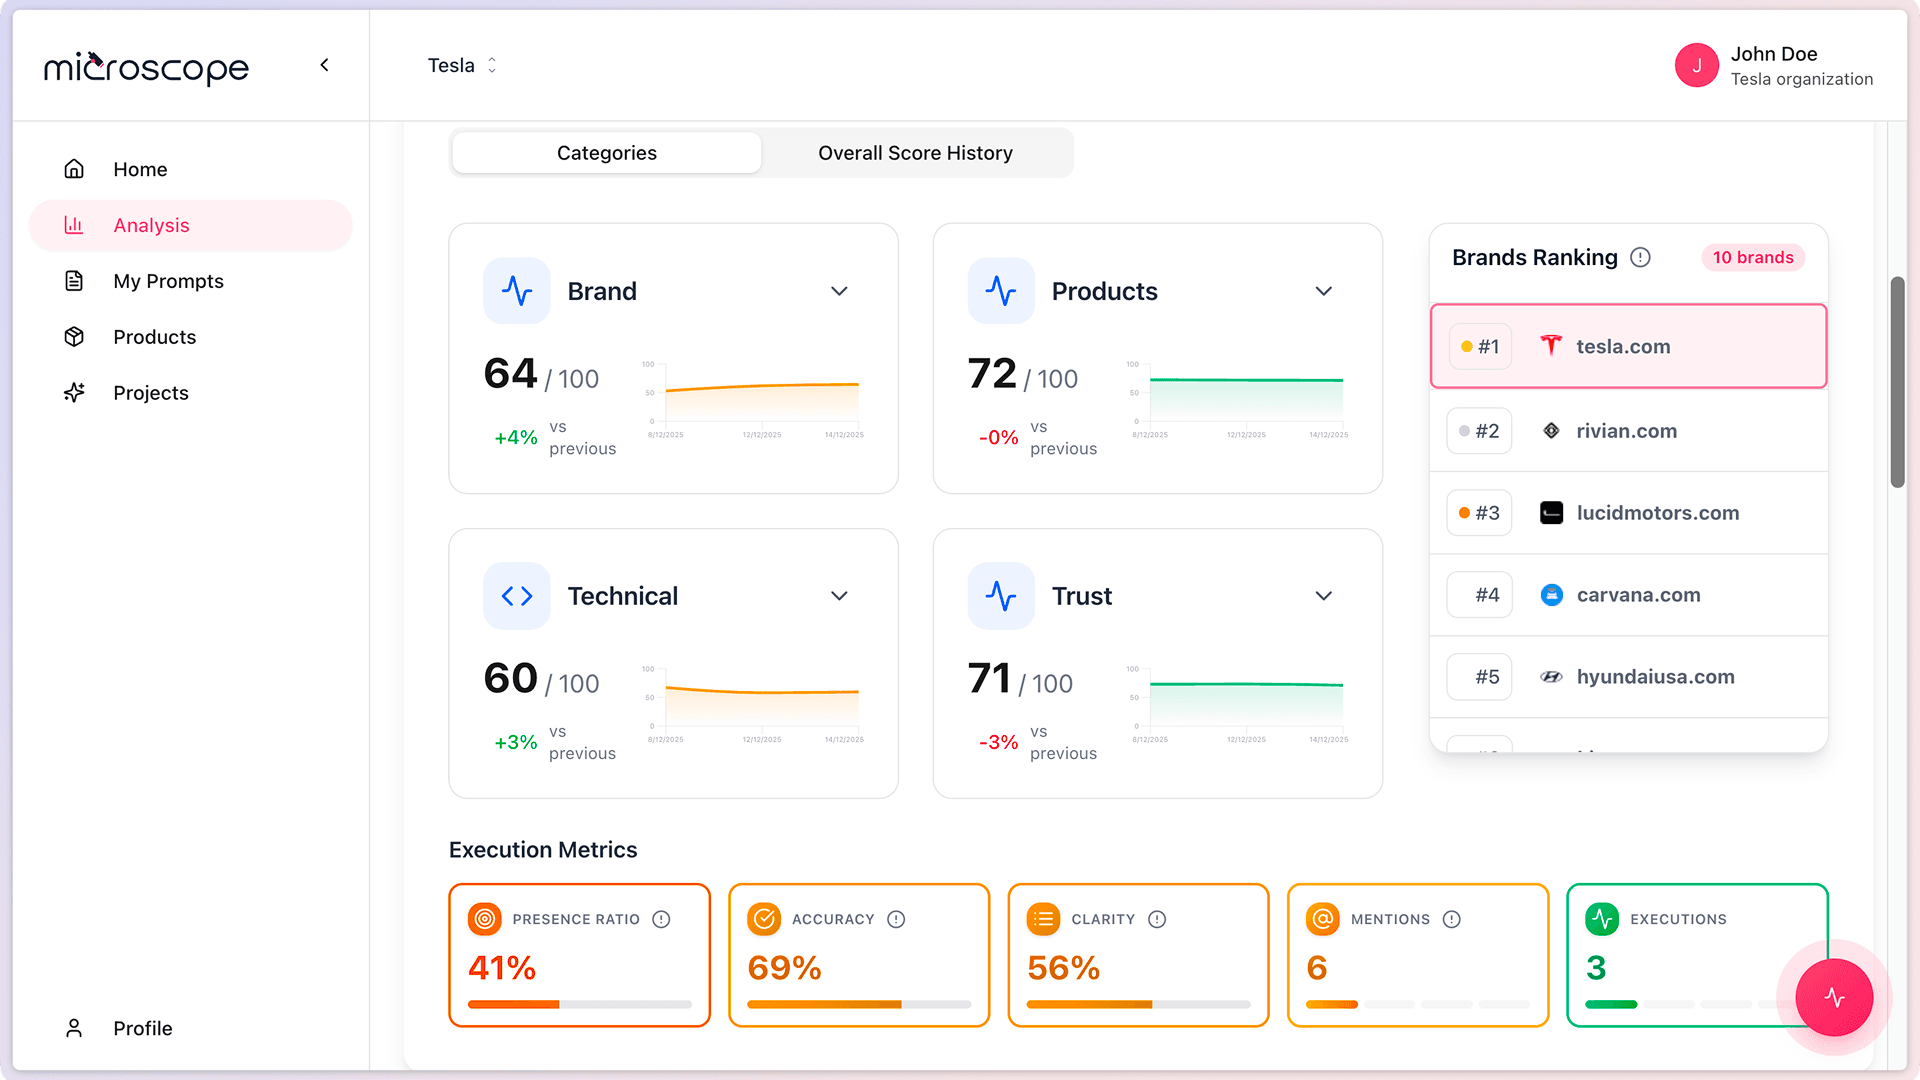
Microscope.ai provides a straightforward scoring system that evaluates your AI presence across key dimensions. The system focuses on visibility, accuracy, and positioning in AI responses.
Overall Score
A single percentage score that represents your overall AI presence performance across all evaluated prompts and AI models.
Key Performance Areas
- Visibility - How often your brand/products are mentioned by AI
- Accuracy - Whether the information provided is correct
- Positioning - Where you appear in AI responses compared to competitors
Understanding Your Scores
Scores are presented as percentages and help you understand how well your brand and products are represented in AI responses. Higher scores indicate better performance, but focus on trends and relative improvements rather than absolute numbers.
Using Scores to Drive Action
Your scores indicate areas where you can improve your AI presence. Focus on the areas with the lowest scores first.
Common Improvement Areas
- Low visibility - Improve online presence and content discoverability
- Poor positioning - Strengthen competitive advantages and unique value
- Inaccuracy issues - Update and correct factual information
- General optimization - Enhance content quality and authority
Scoring Best Practices
- Track consistently - Monitor scores over time to see trends
- Focus on improvement - Look for upward trends rather than absolute values
- Be patient - AI presence improves gradually with consistent effort
- Prioritize impact - Focus on areas that matter most to your business
Next Steps
With scoring understood, you're ready to:
- Explore detailed results for specific prompts
- Compare results across different executions
- Identify optimization opportunities
- Track improvements over time